Objective
If you need to visualize data using advanced chart-types and styling, then the Chart.js extension in DocFusion is ideal for your use-case. Chart.js features can be applied to any chart generated by DocFusion, and is available through the Charts Smart-Part. Its functionality is based on the robust JavaScript library of the same name, which adds a variety of additional customization options to DocFusion charts. Consult the reference at the end of this article for more information on Chart.js and its capabilities.
This guide shows you how to use the Chart.js extension to customize a bar chart.
Availability
The Chart.js feature is available on:
| DocFusion Cloud | DocFusion 365 | DocFusion On Premises | |
|---|---|---|---|
| Template Designer Version | 2022.3.0.180 or later | 2022.3.0.180 or later | 2022.3.0.180 or later |
| Workbench Version | 2022.3.0.180 or later | 2022.3.0.180 or later | 2022.3.0.180 or later |
| Workflow Designer Version | 2022.3.0.180 or later | 2022.3.0.180 or later | 2022.3.0.180 or later |
Steps
The following steps assumes that your DocFusion template already contains a chart rendered using the Chart Smart-Part.
Step 1: Extend your chart configuration for Chart.js
Select any chart in your template by clicking it. Then click Smart-Part Properties in the DocFusion ribbon bar. The Properties window for your chart will open.
Now enable the checkbox labelled ‘Use Chart.js’. Notice the additional fields that have been added to your configuration window.
When extending a chart to use Chart.js functionality, all configuration settings and datapoints that were previously set are retained. Enabling Chart.js functionality simply alters the engine that renders your chart.

 Activating Chart.js for your chart
Step 2: Configure Chart.js
Configuring Chart.Js allows you to control the setup for your chart colours and its background independently.
 Configure Chart.js
First configure your chart
Click the ellipses alongside the ChartJs Config field. The configuration window opens with a string constant containing the default settings.
If you’ve just extended your chart for Chart.Js, the value will be ‘None’. This is the default since you haven’t set any configuration options yet.
Click the ellipses alongside the Constants field to open the configuration options.
You now have access to several configuration options for your chart. Set the styling and layout options as you need.
Click Save to return to the Chart configuration window.
Next, configure a chart background if necessary
This task is optional. If you don’t set a background, the default colour of white will be used to render your chart.
Like configuring other Chart.js settings in the Smart-Part Properties window, access the background colour settings by clicking the ellipses alongside the ChartJs Background Colour field. The Constants window will open. To access the settings for your chart background, click the ellipses again.
Now set the RGB and alpha (transparency) values for your chart background.
Click Save to return to the Chart configuration window.
Step 3: Preview your chart
If you’ve adjusted any datapoints for your chart, you may need to update scenario data for your template before previewing the document. To do this, click Scenarios to open the Scenario Editor.
Hit Preview to generate your document. To generate the chart using a specific set of scenario data, click the dropdown alongside the Preview tool.
 Generate your document to test your Chart.js configuration
Supported Chart Types
To change the type of chart to draw when using Chart.js, simply select the appropriate chart from the Chart Type field in the Datapoints table on the Chart Smart-Part Properties window.
When using Chart.js to draw dynamic charts in DocFusion, the following chart types are supported:
| Chart-Type | Function | |
|---|---|---|
 | Line | Graphical representation of data where datapoints plotted against an X and Y axis are joined into a continuously line. |
 | Bar | Represents categorical data using rectangular bars with heights that are proportional to the values being plotted against the Y axis. |
 | Horizontal Bar | Represents data using rectangular bars with lengths that are proportional to the values being plotted against the X axis. |
 | Radar | Plots data in the form of a two-dimensional chart containing three or more variables on axes that start from the same point. |
 | Donut | A circular representation of data that shows the relationship of parts to the whole. |
 | Polar Area | Used to plot cyclic phenomena, e.g. count of births per month. Similar to a pie chart, except for the radius that each sector extends from the centre. |
 | Bubble | A multi-variable graph that uses a Cartesian coordinate system to plot points along a grid where the X and Y axes are separate variables. |
 | Pie | A circular representation of data that shows the relationship of parts to the whole. |
 | Scatter | Used to discover relationships between variables. Scatter charts use dots to represent values for different numeric variables, and the position of the dots on the horizontal and vertical axes indicates the values for individual datapoints. |
Chart.js Plugin Support
Plugins extend the functionality of charts that are rendered using Chart.js. A wide variety of them are available online, and DocFusion caters for the addition of multiple plugins to any Chart Smart Part configured for Chart.js. This creates many content possibilities for your document templates.
Using Chart.js plugins
To add plugins to charts rendered with Chart.js, simply enable the ‘Use Chart.js’ setting on any Chart Smart Part. This operation will make the ‘Chart.js Plugins’ field visible. Thereafter, click the ellipses alongside the field to configure Chart.js plugins.
.png) Enabling plugin support for Chart.Js
Enabling plugin support for Chart.Js
You will need to configure the following fields to successfully integrate a plugin:
- Plugin Source: The URL that specifies the location of the Chart.js plugin.
- Source Type: Species whether to load the plugin module by referencing the source URL or include the source in-line.
- JS Plugin Identifier: A String identifier that matches the name of the plugin.
- JS Plugin Config Object: The JavaScript code to construct the plugin object.
Once you’re done configuring the plugin, Save your changes and Preview your document template to test the output.
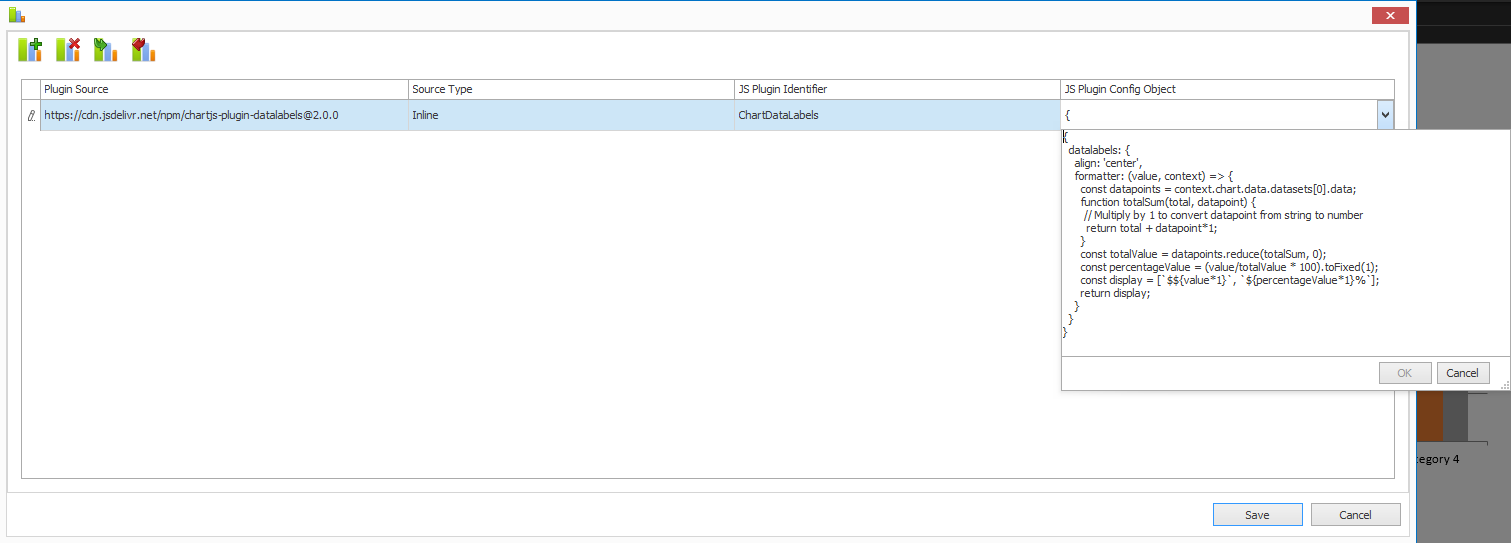 Chart.Js plugin configuration
Additional Resources
- Tutorial: Visualize payments using a bar chart
- Chart.Js documentation is available at https://chartjs.org